Ahoy matey! Hearken to me, as I spin a tale of a powerful cartographic tool. A map foretold in legends, beautifully wrought, deeply detailed, with a siren call beckoning the adventurous to click on it. What is this wond’rous construct, pray tell? ‘Tis none other than … a javascript map.
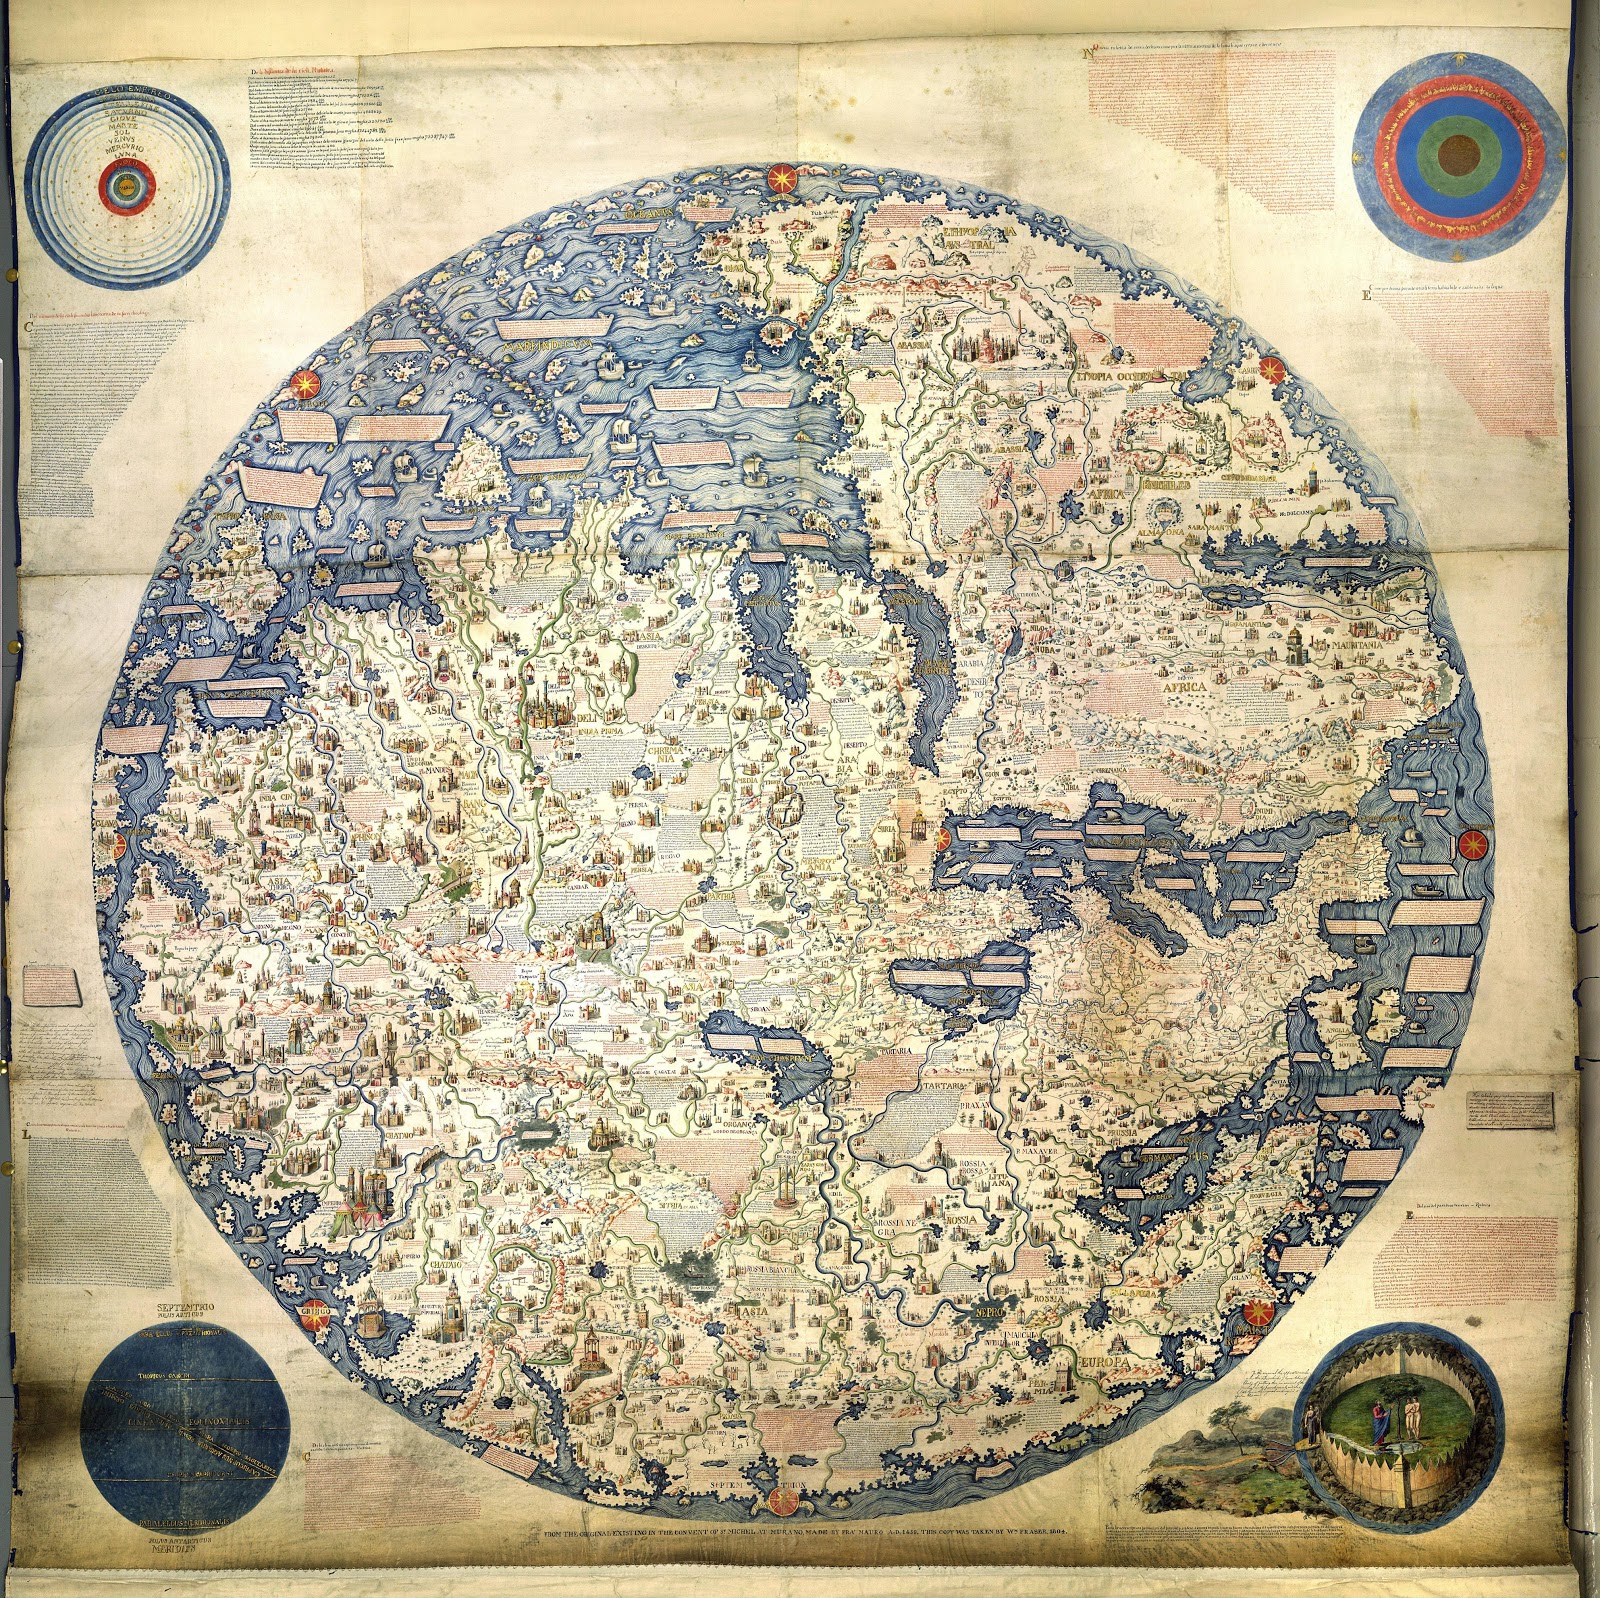
Creating an online map not only adds an impressive amount of dynamism to a web app, it’s also relatively simple to do once you’ve got the hang of the basics. Although online maps have their own unique implementation, the visual language of a map is deeply rooted in our consciousness – who hasn’t been enraptured by a deeply detailed piece of cartography like this one?
In this article, I’m going to walk through the basic steps to creating a ‘web map’. We’ll cover:
- The format of GeoJSON
- Finding and initializing a basemap
- Adding data to a map
- Adding interactivity to a map
Along the way, I promise to keep the pirate/nautical puns to a minimum. Although, it’s going to be hARRRd. Ready? Let’s get started!
First off, there are a number of JavaScript mapping tools and APIs we can utilize to build our map: Mapbox GLJS, Leaflet.js, and Google just to name a few. For the purposes of this demonstration, we’ll be using Leaflet.js, but a lot of the core principles will remain the same no matter which SDK or API you decide to use.
Before we get into the actual building part, it’s worth pausing a moment to discuss what a web map actually is made up of. Essentially, a web map becomes initialized in a series of layers. At the bottom layer is the base map – these are the geographic features that make up the globe. Companies like OpenMapTiles and Mapbox have a number of base maps that can act as canvases for your data visualizations.
On top of those “canvases”, we paint the specific data that’s pertinent to your story. For example, this is an example of a basemap provided by Mapbox:
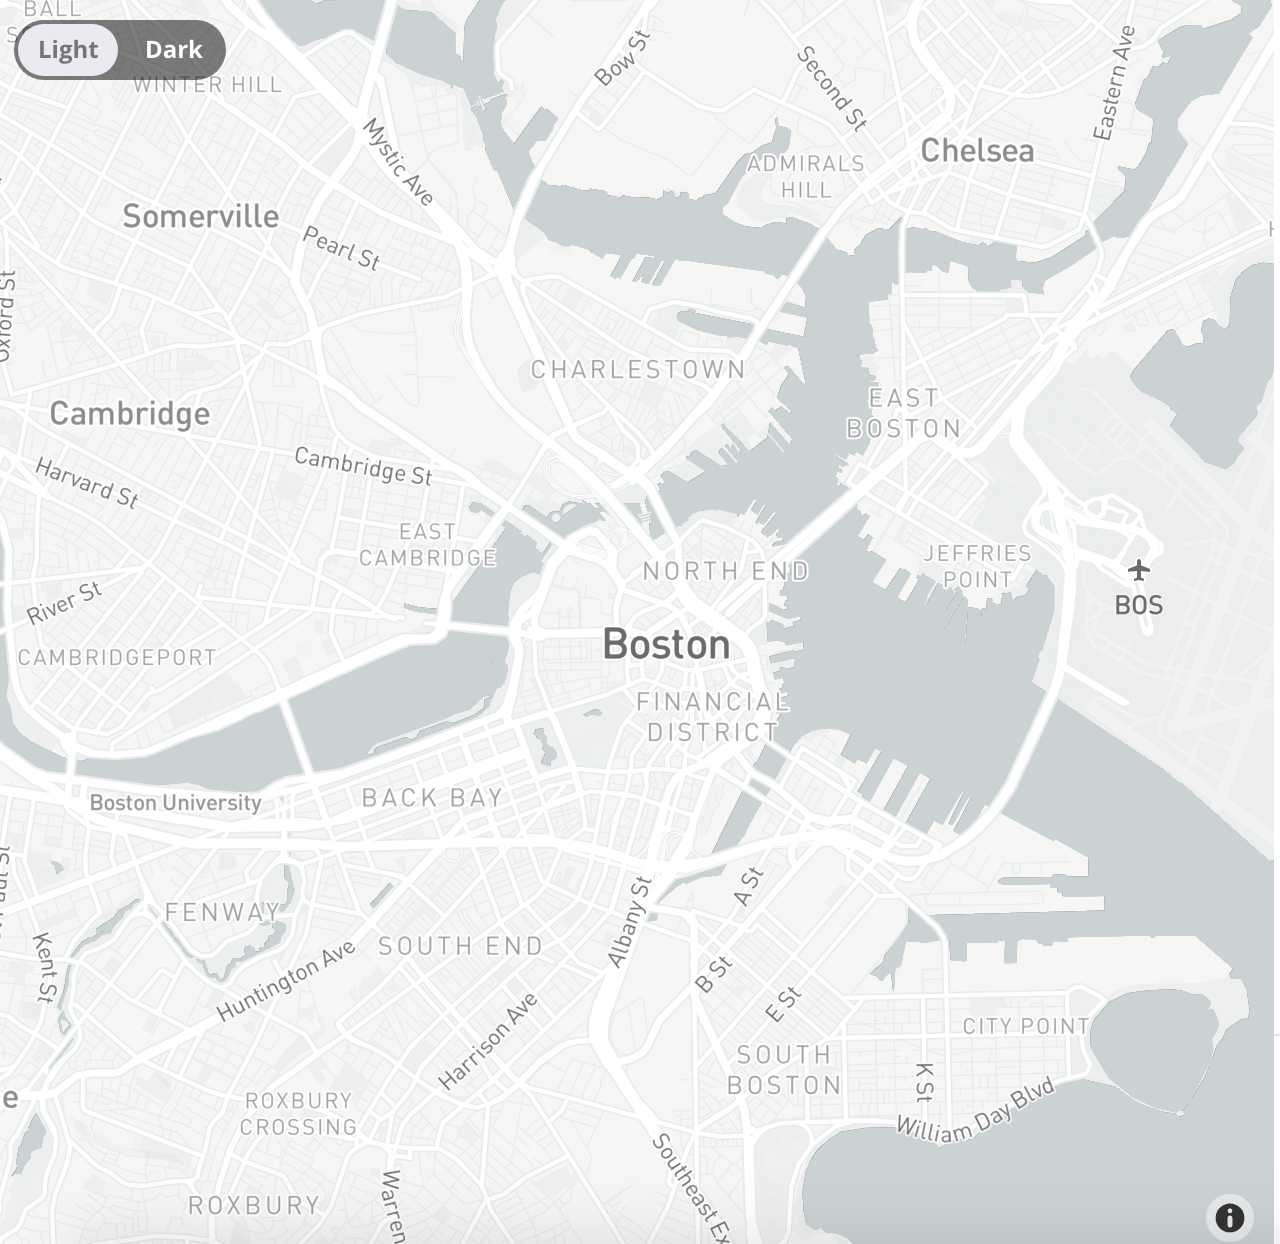
That’s a pretty simplistic explanation for what a web map is, but it serves as a baseline for understanding the interaction between your map layers and the base map (canvas) on which you’ll add your custom data.
And speaking of data: most web maps use a specific data type called GeoJSON. JSON is JavaScript Object Notation, and Geo refers to ‘being of the earth’ so you can probably piece together what that portmanteau signifies. GeoJSON looks like the following:
{
"type": "Feature",
"geometry": {
"type": "Point",
"coordinates": [125.6, 10.1]
},
"properties": {
"name": "Dinagat Islands"
}
}
A piece of data within GeoJSON has the following attributes:
- Geometry – This can be a Point, LineString, Polygon, MultiPoint, MultiLineString, MultiPolygon, or a GeometryCollection.
- Type – This will pretty much always be a Feature, as a feature is a combination of Geometry and Properties.
- Properties – A collection of extra data that is associated with a piece of GeoJSON data, helpful for further classifying a feature.
If you’re working on a map, and you want to display a set of data, you’ll need to turn your data into geoJSON at some point. This can be one of the trickier parts of a map project. If you want a more comprehensive look at geoJSON, check out Tom MacWright’s fabulous article on More Than You Ever Wanted to Know About Geojson.
‘Yarr, when do we get to see our map?’ I hear you growling over a flaggon of grog. After including Leaflet in your project, create an HTML element with a defined height. Something like:
<div id=”map” style=”height: 500px;”> </div>
Then, initialize your first layer (the base map) using the following syntax:
const tileLayer = L.tileLayer('https://api.mapbox.com/styles/v1/mapbox-token-goes-here-along-with-map-id', {
id: 'mapbox.light',
noWrap: true,
attribution: false,
bounds: [
[90, -180],
[-90, 180]
]
});
That ‘L’ represents the Leaflet object, and will come up time and again as the means by which to interface with the Leaflet map you are creating. You can see we pass in an ID that refers to the mapbox map we are using (see the image above), as well as the bounds for the map itself (those coordinates represent the edges of our map). We are then going to pass that tileLayer object into the map with the following:
const map = L.map('map', {
center: [39.73, -104.99],
zoom: 2,
maxZoom: 15,
minZoom: 2,
layers: [tileLayer],
});
We’re setting the minimum and maximum zoom levels, as well as the initial state of the map. We pass our layer in via the ‘layers’ property of L.map. If we refresh the browser, we should see our basemap taking up the contents of the div we defined. Avast!
Next, we’d like to populate this map with our data. To do so, we’ll utilize a plugin called Leaflet Ajax. This will let us keep our geoJSON file externally to our JavaScript file, but still be able to initialize a new layer using the data it represents. Let’s say, for instance, we had a geoJSON feature set in a directory aptly called ‘geojson’. We might do the following:
const geojsonLayer = new L.GeoJSON.AJAX('geojson/mygeojson.geojson', {
style: {
weight: 1
},
});
And then follow that up with:
map.addLayer(geojsonLayer);
You can see here the manifestation of the layering process I alluded to earlier: the basemap is included with the initialization of the map, and then an additional layer is added on top with…you guessed it…map.addLayer().
We don’t just have to put up with a plain geoJson Layer sans fixins – we can configure the layer itself to extend its functionality and add custom styling. Looping back to our geojsonLayer, we can add:
const geojsonLayer = new L.GeoJSON.AJAX('geojson/mygeojson.geojson', {
style: {
weight: 1
},
onEachFeature: pointEach
});

function pointEach(feature,layer){
layer.on({
click: showPopup,
mouseover: doAnotherThing
})
}

function showPopup(e){
e.target.bindPopup(`<p> ${e.target.feature.properties[‘title’]}</p>`);
}
Let’s break this down a bit. First off, we’ve added a new property to the geojson layer called on onEachFeature which…you guessed it… adds the method pointEach to each feature within the geojson set. In turn, pointEach has two arguments: feature and layer. We aren’t utilizing them in this example, but the feature contains all of the information you might need from the individual features within a geojson featureset.
Click and mouseover are just two of the possible options for DOM manipulation of your geojson layer. You can then define what’s going to happen “on click” or “on mouseover” or on “mouseleave” and so on and so on. In this case, we have a simple popup that displays on click that shows the title of the feature you clicked on.
Remember when we talked about the properties of a Geojson feature in the previous section? This is where we get the information we might want to display (or manipulate) based upon user interaction with our map. Many times, it might be useful to utilize the feature values found in pointEach (feature, layer) to add divergent logic. For example, if a feature has a date below 1970 the popup might display a different message than a feature with a date above 1970.
And that’s about all I have for you scallywags today. I hope this brief introduction into the world of mapping has inspired you to build a map (or two) of your own. Be good.